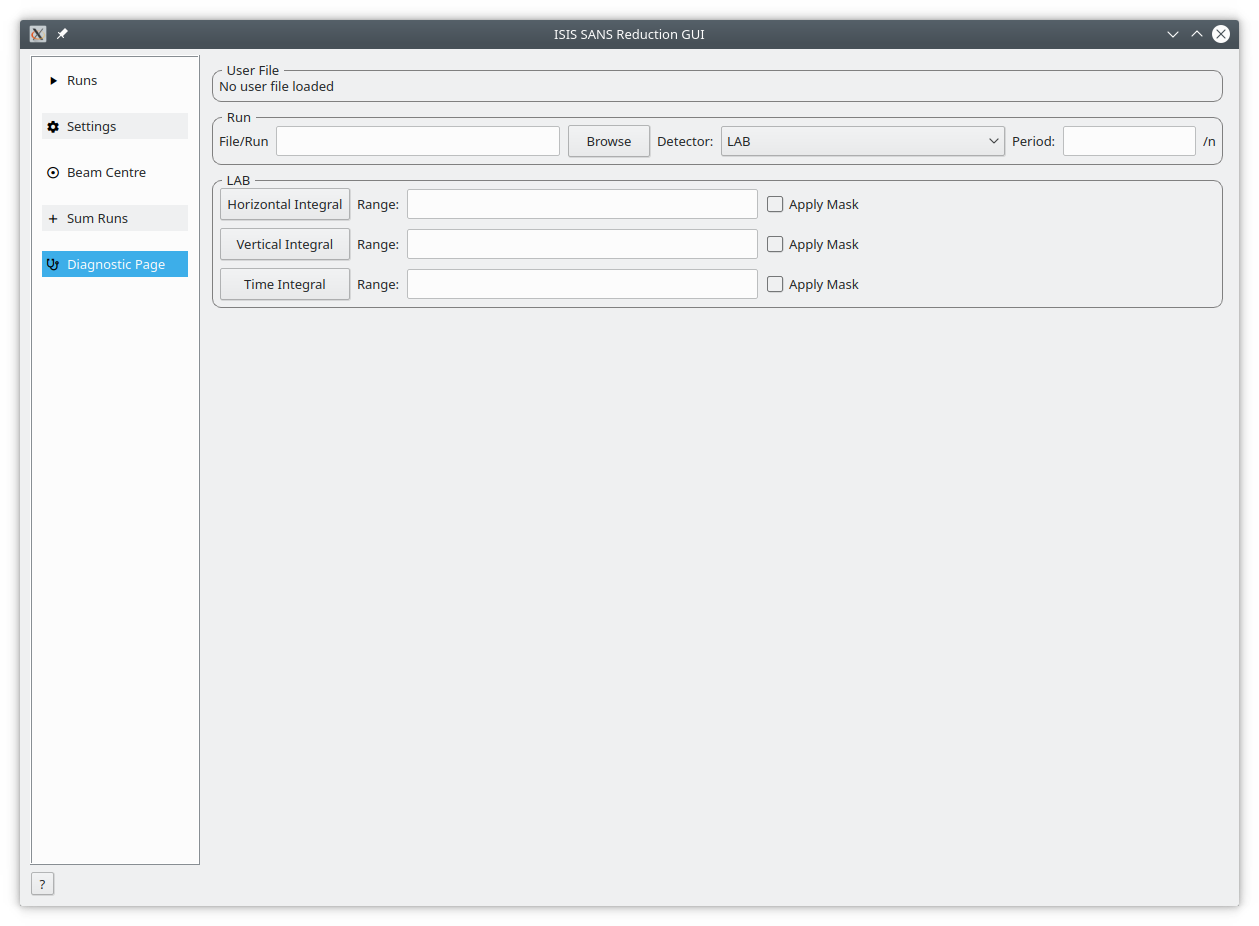
The diagnostic tab allows quick integrations to be done on a workspace.
| User File | The currently loaded user file, this is loaded on the runs tab |
| Run | The run number of file name to be considered the instrument is taken from the run tab |
| Detector | The detector to be considered |
| Period | The period to be considered if applicable if left blank will do all periods |
| Integration buttons | These three buttons start an integration on the selected workspace. The horizontal integral sums up each row, the vertical integral each column and the time integral sums across time bins. |
| Range | The range over which to do the integration. If integrating columns this is a range of rows, if summing rows a range of columns and if summing bins a range of spectra. Dashes signify a range so 1-5 for instance will integrate between rows 1 and 5 Commas signify different ranges so for example 1-5, 10-20 will intrgrate over both ranges and plot two lines Colons signify a list to integrate individually for example 5:7 is the same as typing 5,6,7 and will produce three curves. |
| Mask | If ticked the masks specified in the userfile will be applied before integrating |